 |
 |
 |
 |
 |
 |
Water Level Changes Entrain Locomotion 4) Tidal Cues - water level- Many intertidal animals synchronize various behaviors with tidal cycles. In some cases, environmental factors that may serve to synchronize the animal's activity to the tidal cycle have been identified and, in general, they are species specific (DeCoursey, 1983; Naylor and Williams 1984). Inundation cycles (Williams and Naylor, 1969), hydrostatic pressure changes (Naylor and Atkinson, 1972), as well as 12.4 h cycles of increased or decreased temperatures and salinities (Reid and Naylor 1990) are sufficient to entrain the locomotor rhythms of the green crab, Carcinus maenas. Hydrostatic pressure changes also synchronize the behavioral activity rhythms of the portunid crabs, Liocarcinus holsatus and L. depurator (Abelló et al., 1991), as well as at least two amphipod species (Nymphon gracile, Morgan et al., 1964; Excirolana chiltoni, Enright, 1965). Salinity changes appear to be effective synchronizing agents for the crabs Rhithropanopeus harrissii (Forward et al., 1986) and C. maenas (Reid and Naylor, 1990). Finally, periodic agitation is sufficient to entrain tidal rhythms in two species of isopods (Klapow, 1972; Hastings, 1981) and juvenile horseshoe crabs (Ehlinger et al., 2006). While there are many field reports of tidally synchronized beach approaches by male and female Limulus during the late spring mating season, we know of no studies that have systematically investigated the cues they may use to synchronize their movements to natural tide cycles. Below are the effects of water level changes on locomotor patterns.
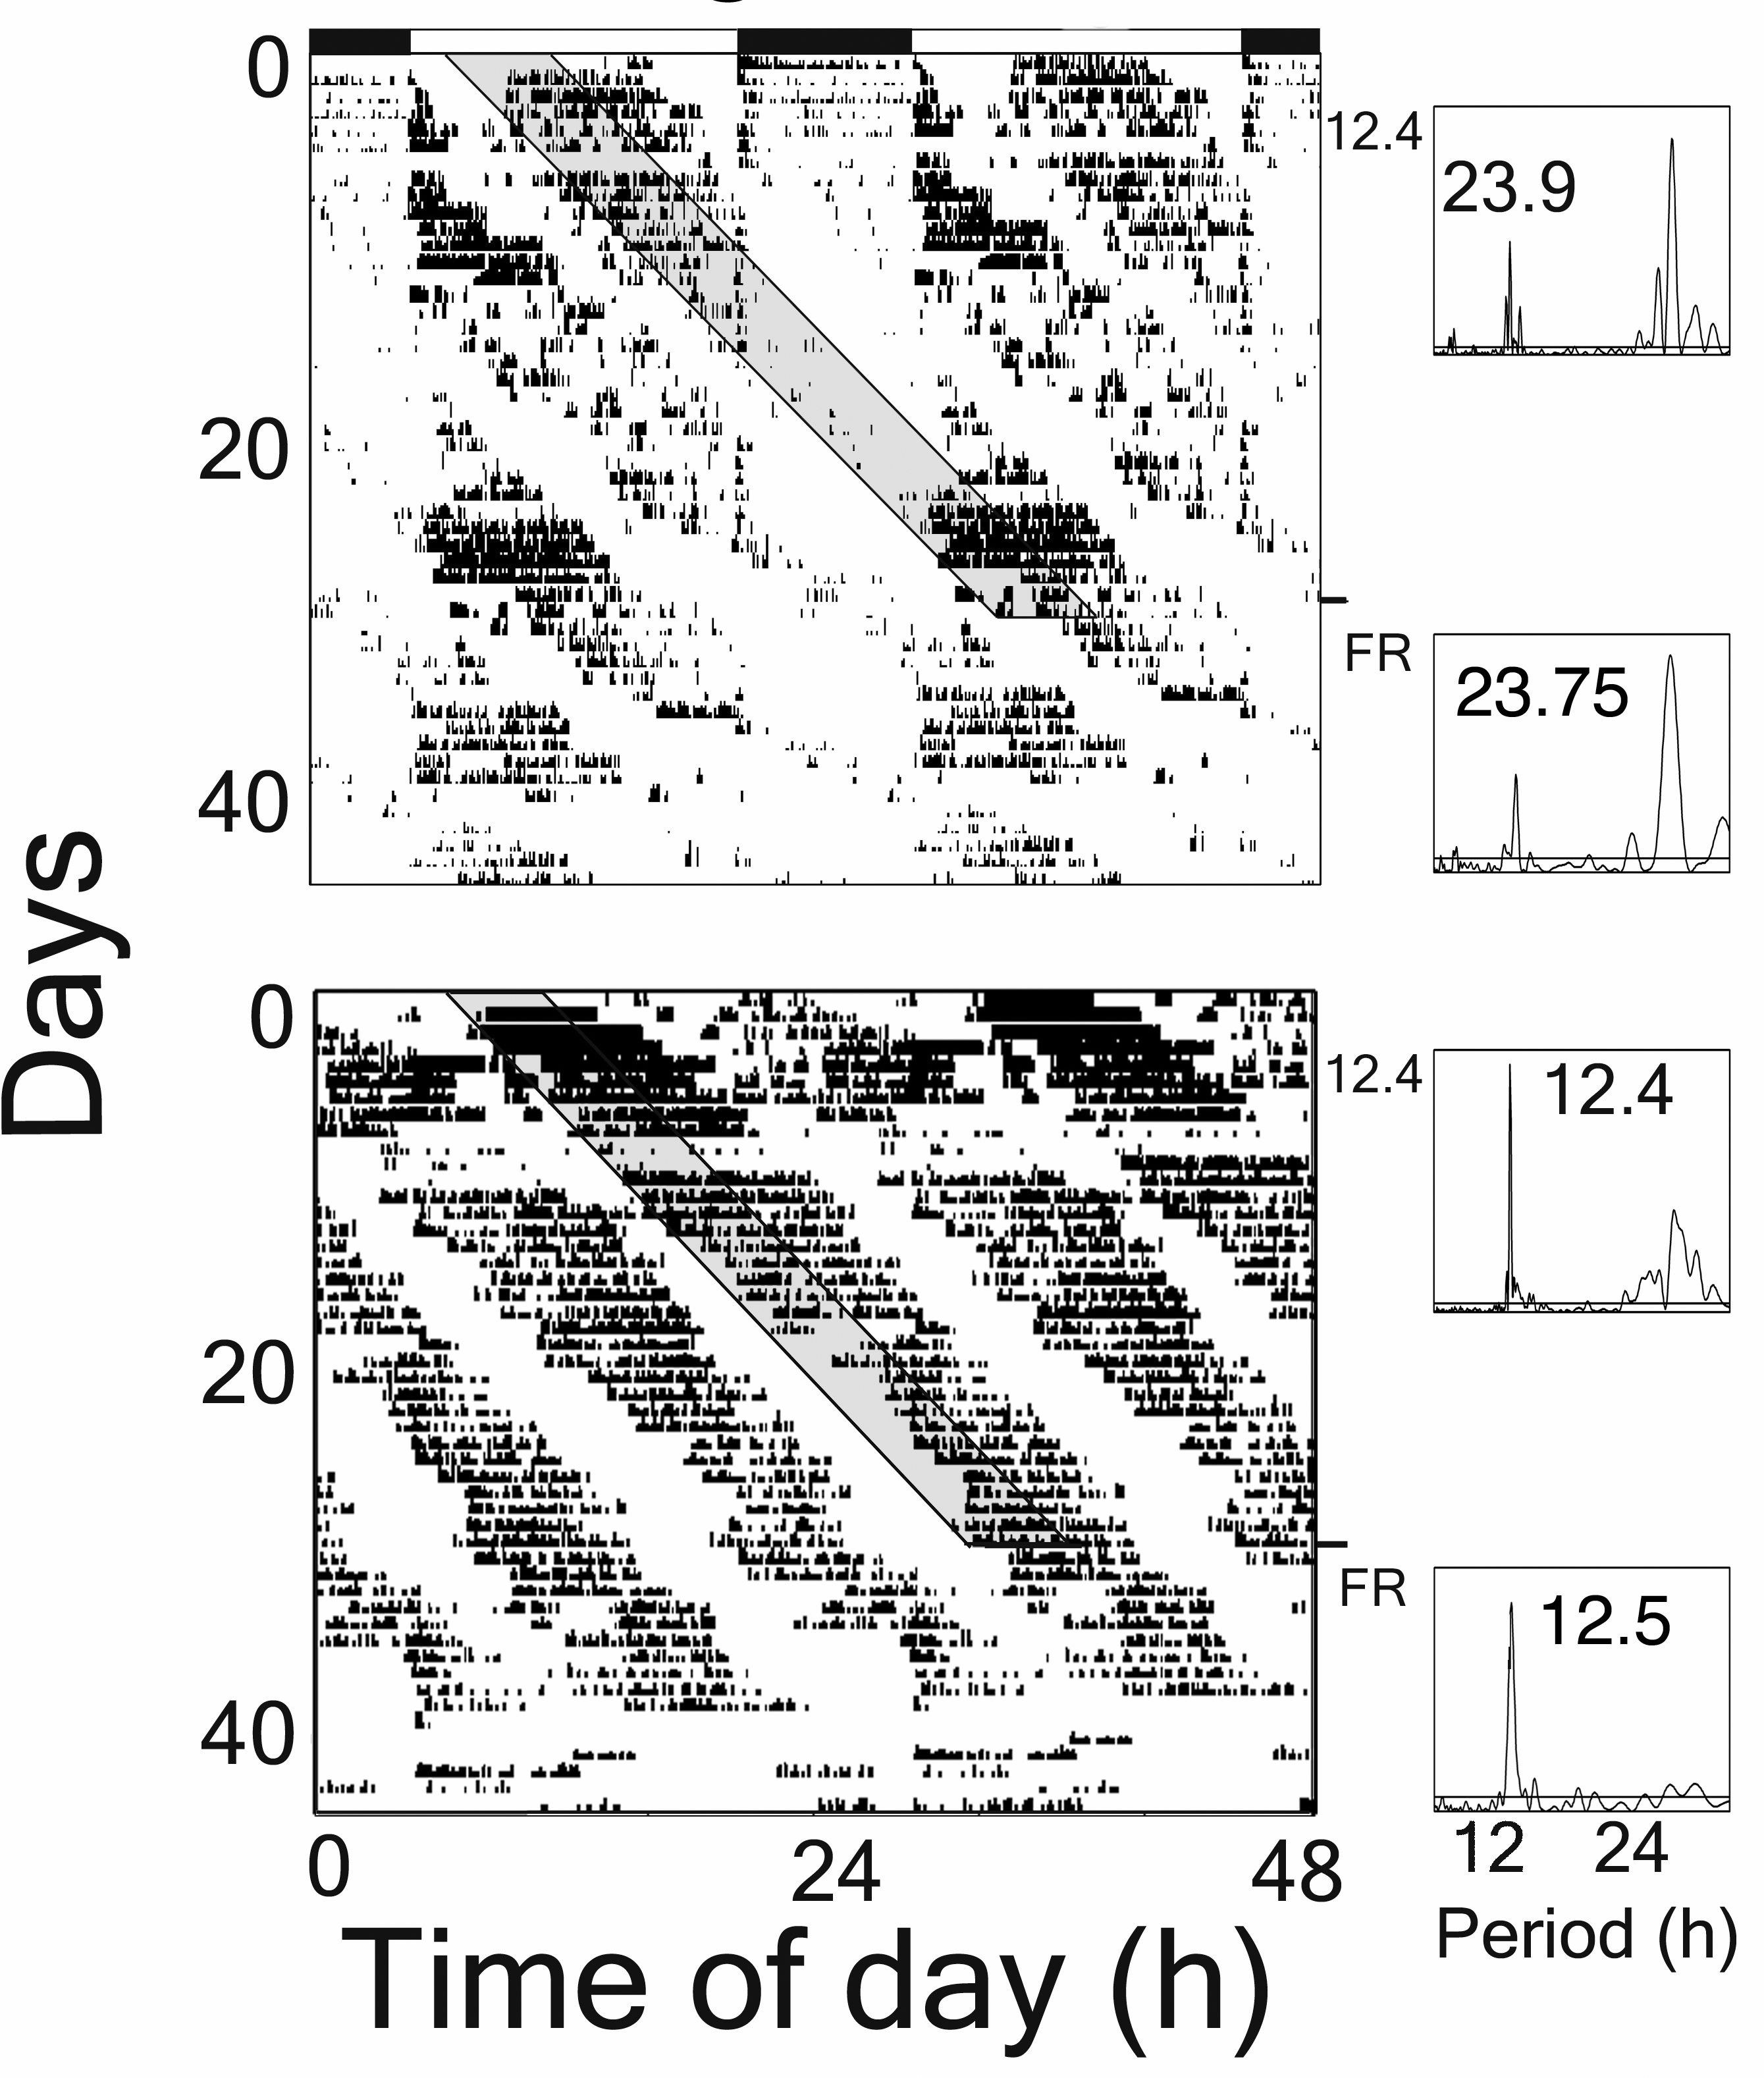
Figure 4: The effects of photoperiod and water depth on locomotor activity of two L. polyphemus. Left panel - actograms double-plotted to improve visualization of the patterns. The 14:10 light:dark cycle (LD) is indicated by black/white bars at the top. Artificial tides (changes in water depth) were delivered at periods of 12.4 h and 12.1 h as indicated by shaded boxes on the actogram. Water depth began to increase at the time indicated by the left side of the boxes and maximum depths occurred at the time indicated by the right side of the boxes. Animals were first exposed to LD and not tides, then LD and tides of two different periods, and finally (bottom actogram only) no tides (constant water depth) and constant darkness (DD). Right panels - Lomb-Scargle periodogram analyses of respective actogram sections; vertical scale – Relative Q(p). Largest peak value above horizontal line of significance (P<0.01) indicated by numerical value. In LD, both the activity records (left panels) and the periodogram analyses (right panels) indicate rhythms in the 24-h range. This pattern was seen in six of eight animals (Tau=24.3 ± 0.2 h; Mean ± SEM) while primary periodicities in the 12 h range were observed in the remaining two animals (data not shown; Tau=11.9 ± 0.1 h). Two of eight animals exhibited significantly more activity during L than D (Fig 4; top; P<0.05), while in the remaining six animals the activity levels exhibited during L and D were not statistically distinguishable (Fig. 4 – bottom panel).
|
|