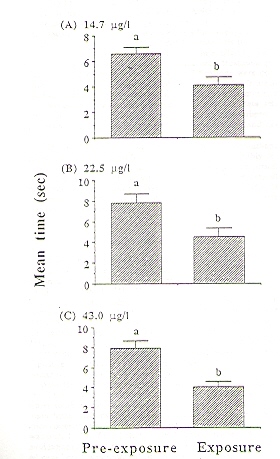
Fig. 2. Mean time spent in the octant (+/- SEM) into which fluoranthene flowed during the exposure period as compared to the time spent in that octant during the pre-exposure period for individual naive fathead minnows (i.e., never before exposed to fluoranthene). Different letters above bars indicate significance at p < 0.05. Fluoranthene concentrations were (A) 14.7 u/1, (B) 22.5 u/1, and (C) 43.0 u/1. For (A) and (C), the experimental subgroups were composed of eight fish. For (B) the experimental subgroups was composed of six fish due to the failure of two fish to meet the requirements for an acceptable test.